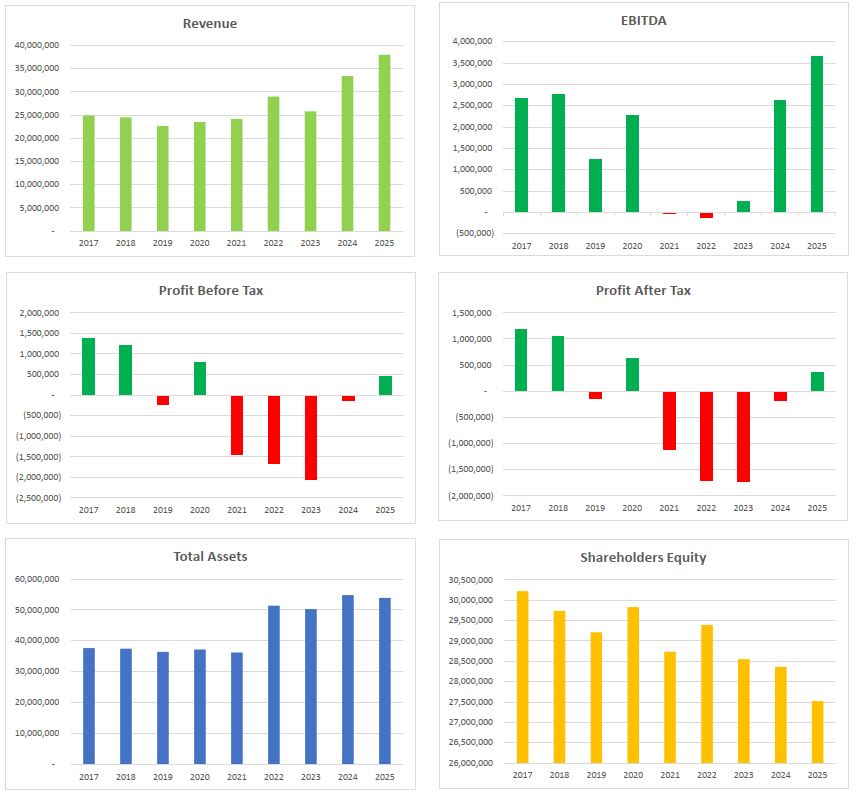
| Revenue (RM'000) | 24,907 | 24,518 | 22,672 | 23,505 | 24,161 | 29,019 | 25,806 | 33,446 | 38,025 |
| EBITDA/(LBITDA) (RM'000) | 2,673 | 2,753 | 1,235 | 2,261 | (52) | (140) | 258 | 2,612 | 3,654 |
| Profit/(loss) before taxation (RM'000) | 1,378 | 1,201 | (227) | 789 | (1,449) | (1,673) | (2,047) | (144) | 447 |
| Profit/(loss) after taxation (RM'000) | 1,176 | 1,045 | (144) | 617 | (1,117) | (1,717) | (1,729) | (192) | 359 |
| Total assets (RM'000) | 37,663 | 37,462 | 36,443 | 37,188 | 36,243 | 51,359 | 50,266 | 54,777 | 53,907 |
| Total borrowings (RM'000) | – | – | – | – | – | 13,446 | 14,134 | 20,063 | 19,463 |
| Shareholders equity (RM'000) | 30,221 | 29,737 | 29,211 | 29,828 | 28,735 | 29,392 | 28,552 | 28,360 | 27,523 |
| Dividend (%) | 4.88 | 3.09 | – | – | – | – | – | – | – |
| Earnings per share (sen)¹ | 6.15 | 5.47 | (0.75) | 3.23 | (5.72) | (2.18) | (2.13) | (0.24) | 0.45 |
| Net assets per share (RM)¹ | 1.58 | 1.56 | 1.53 | 1.56 | 1.50 | 0.37 | 0.35 | 0.35 | 0.35 |